Know a municipality before you invest in it
290 municipalities. 2,000+ neighborhoods. 30+ SCB indicators. One dashboard that scores, ranks, and compares them all.
What you actually get
map.kommunanalys.com
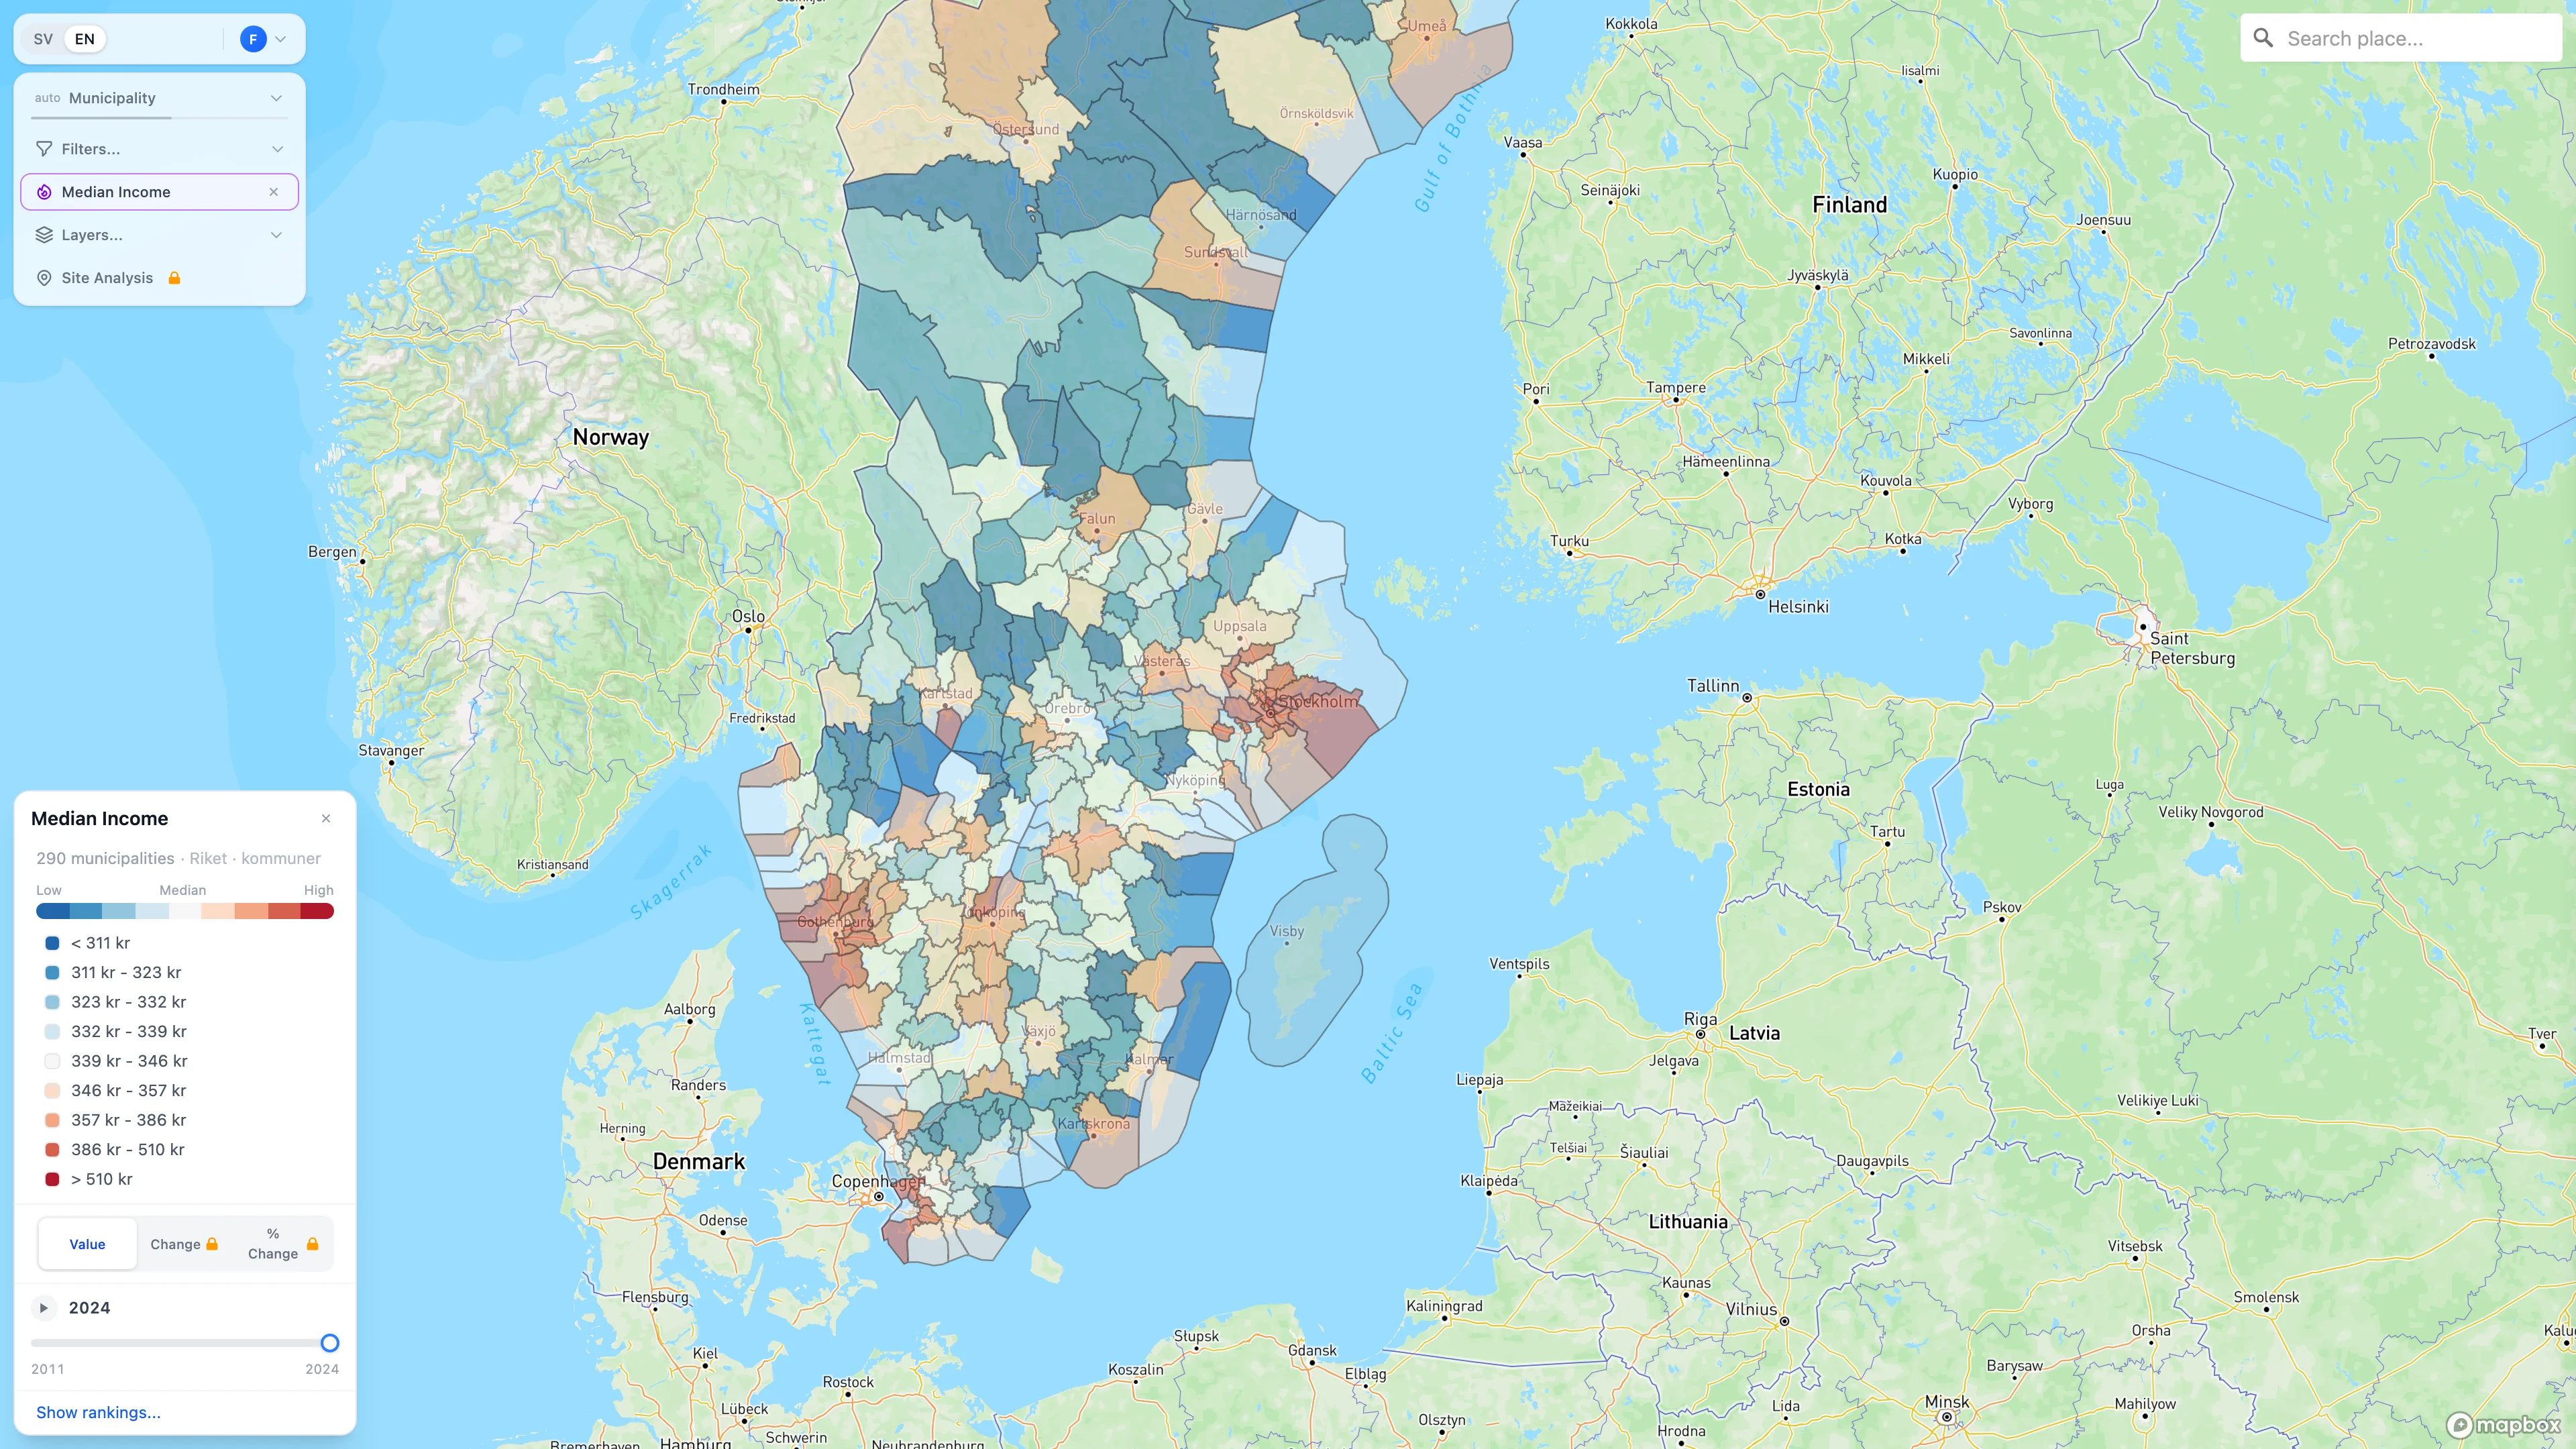
map.kommunanalys.com
map.kommunanalys.com
map.kommunanalys.com
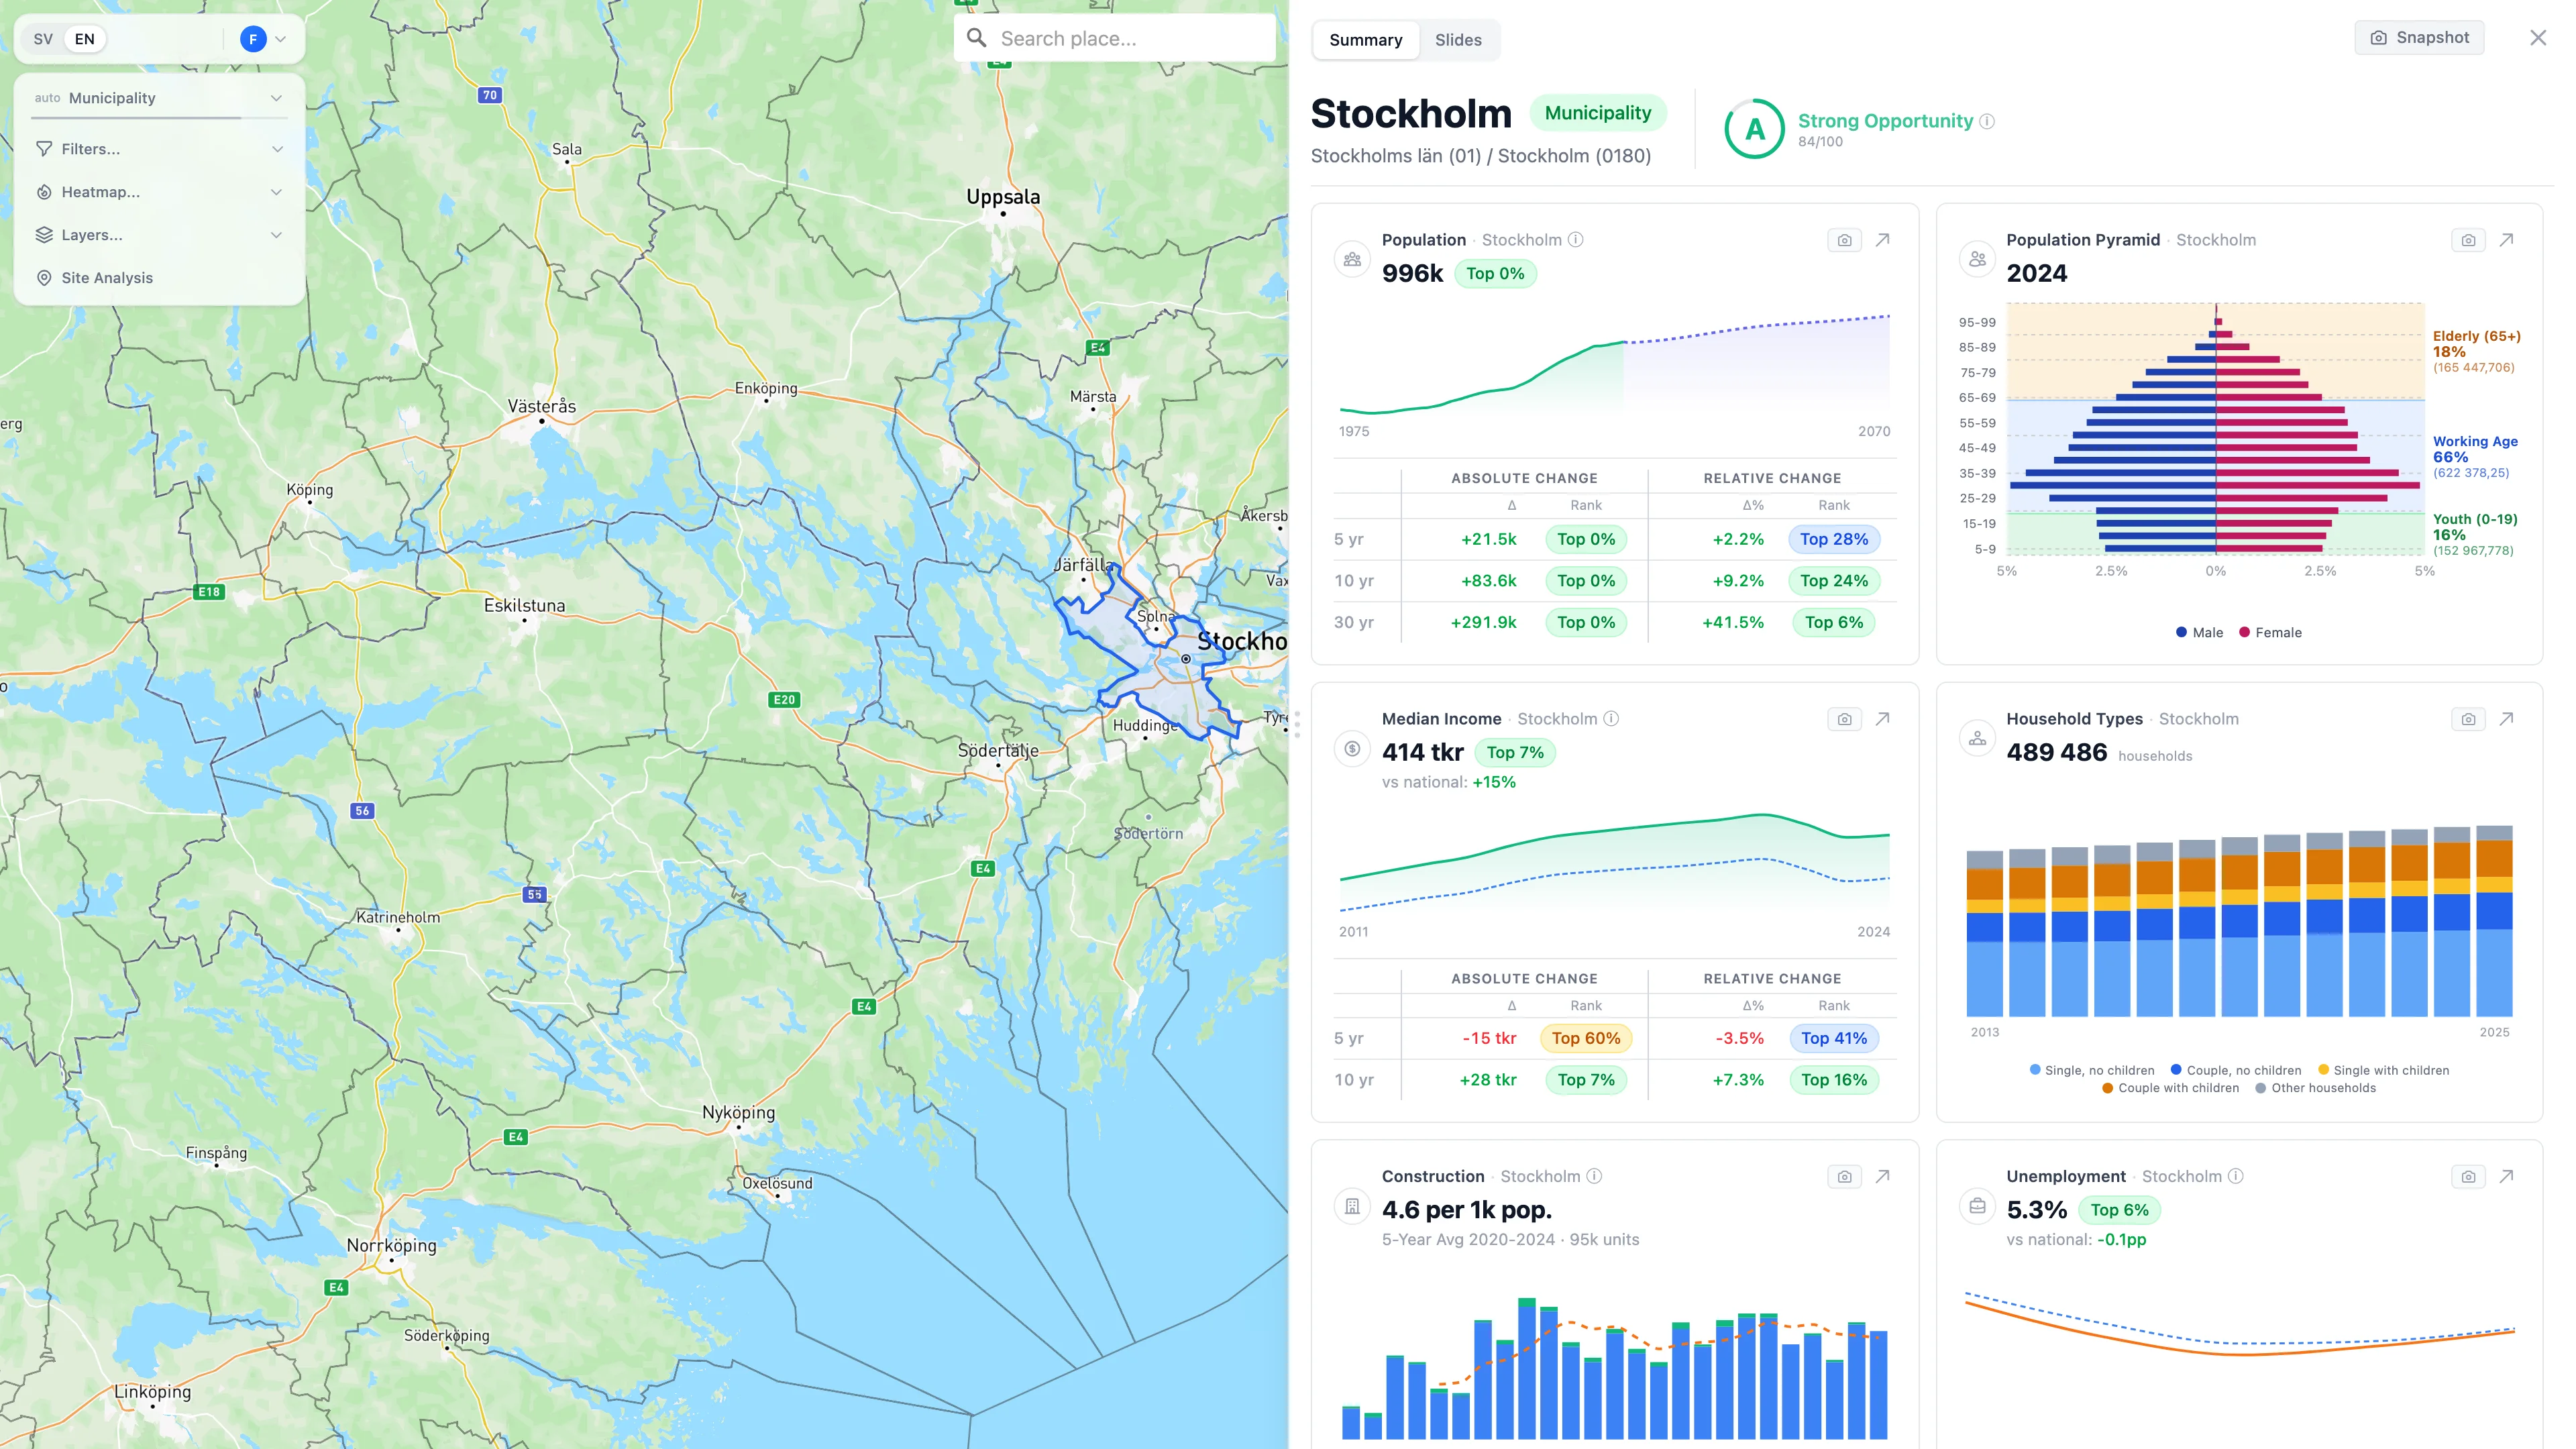
Every municipality gets a score
One number, 0–100, based on 30+ indicators — population growth, income levels, unemployment, construction rates, migration patterns. You see immediately where the fundamentals are strong and where they're deteriorating.
The old way vs. the Kommunanalys way
The old way
- ✕ Engage research institutes — weeks of lead time
- ✕ Pay analysts thousands for a single market report
- ✕ Scattered data across dozens of SCB tables
The Kommunanalys way
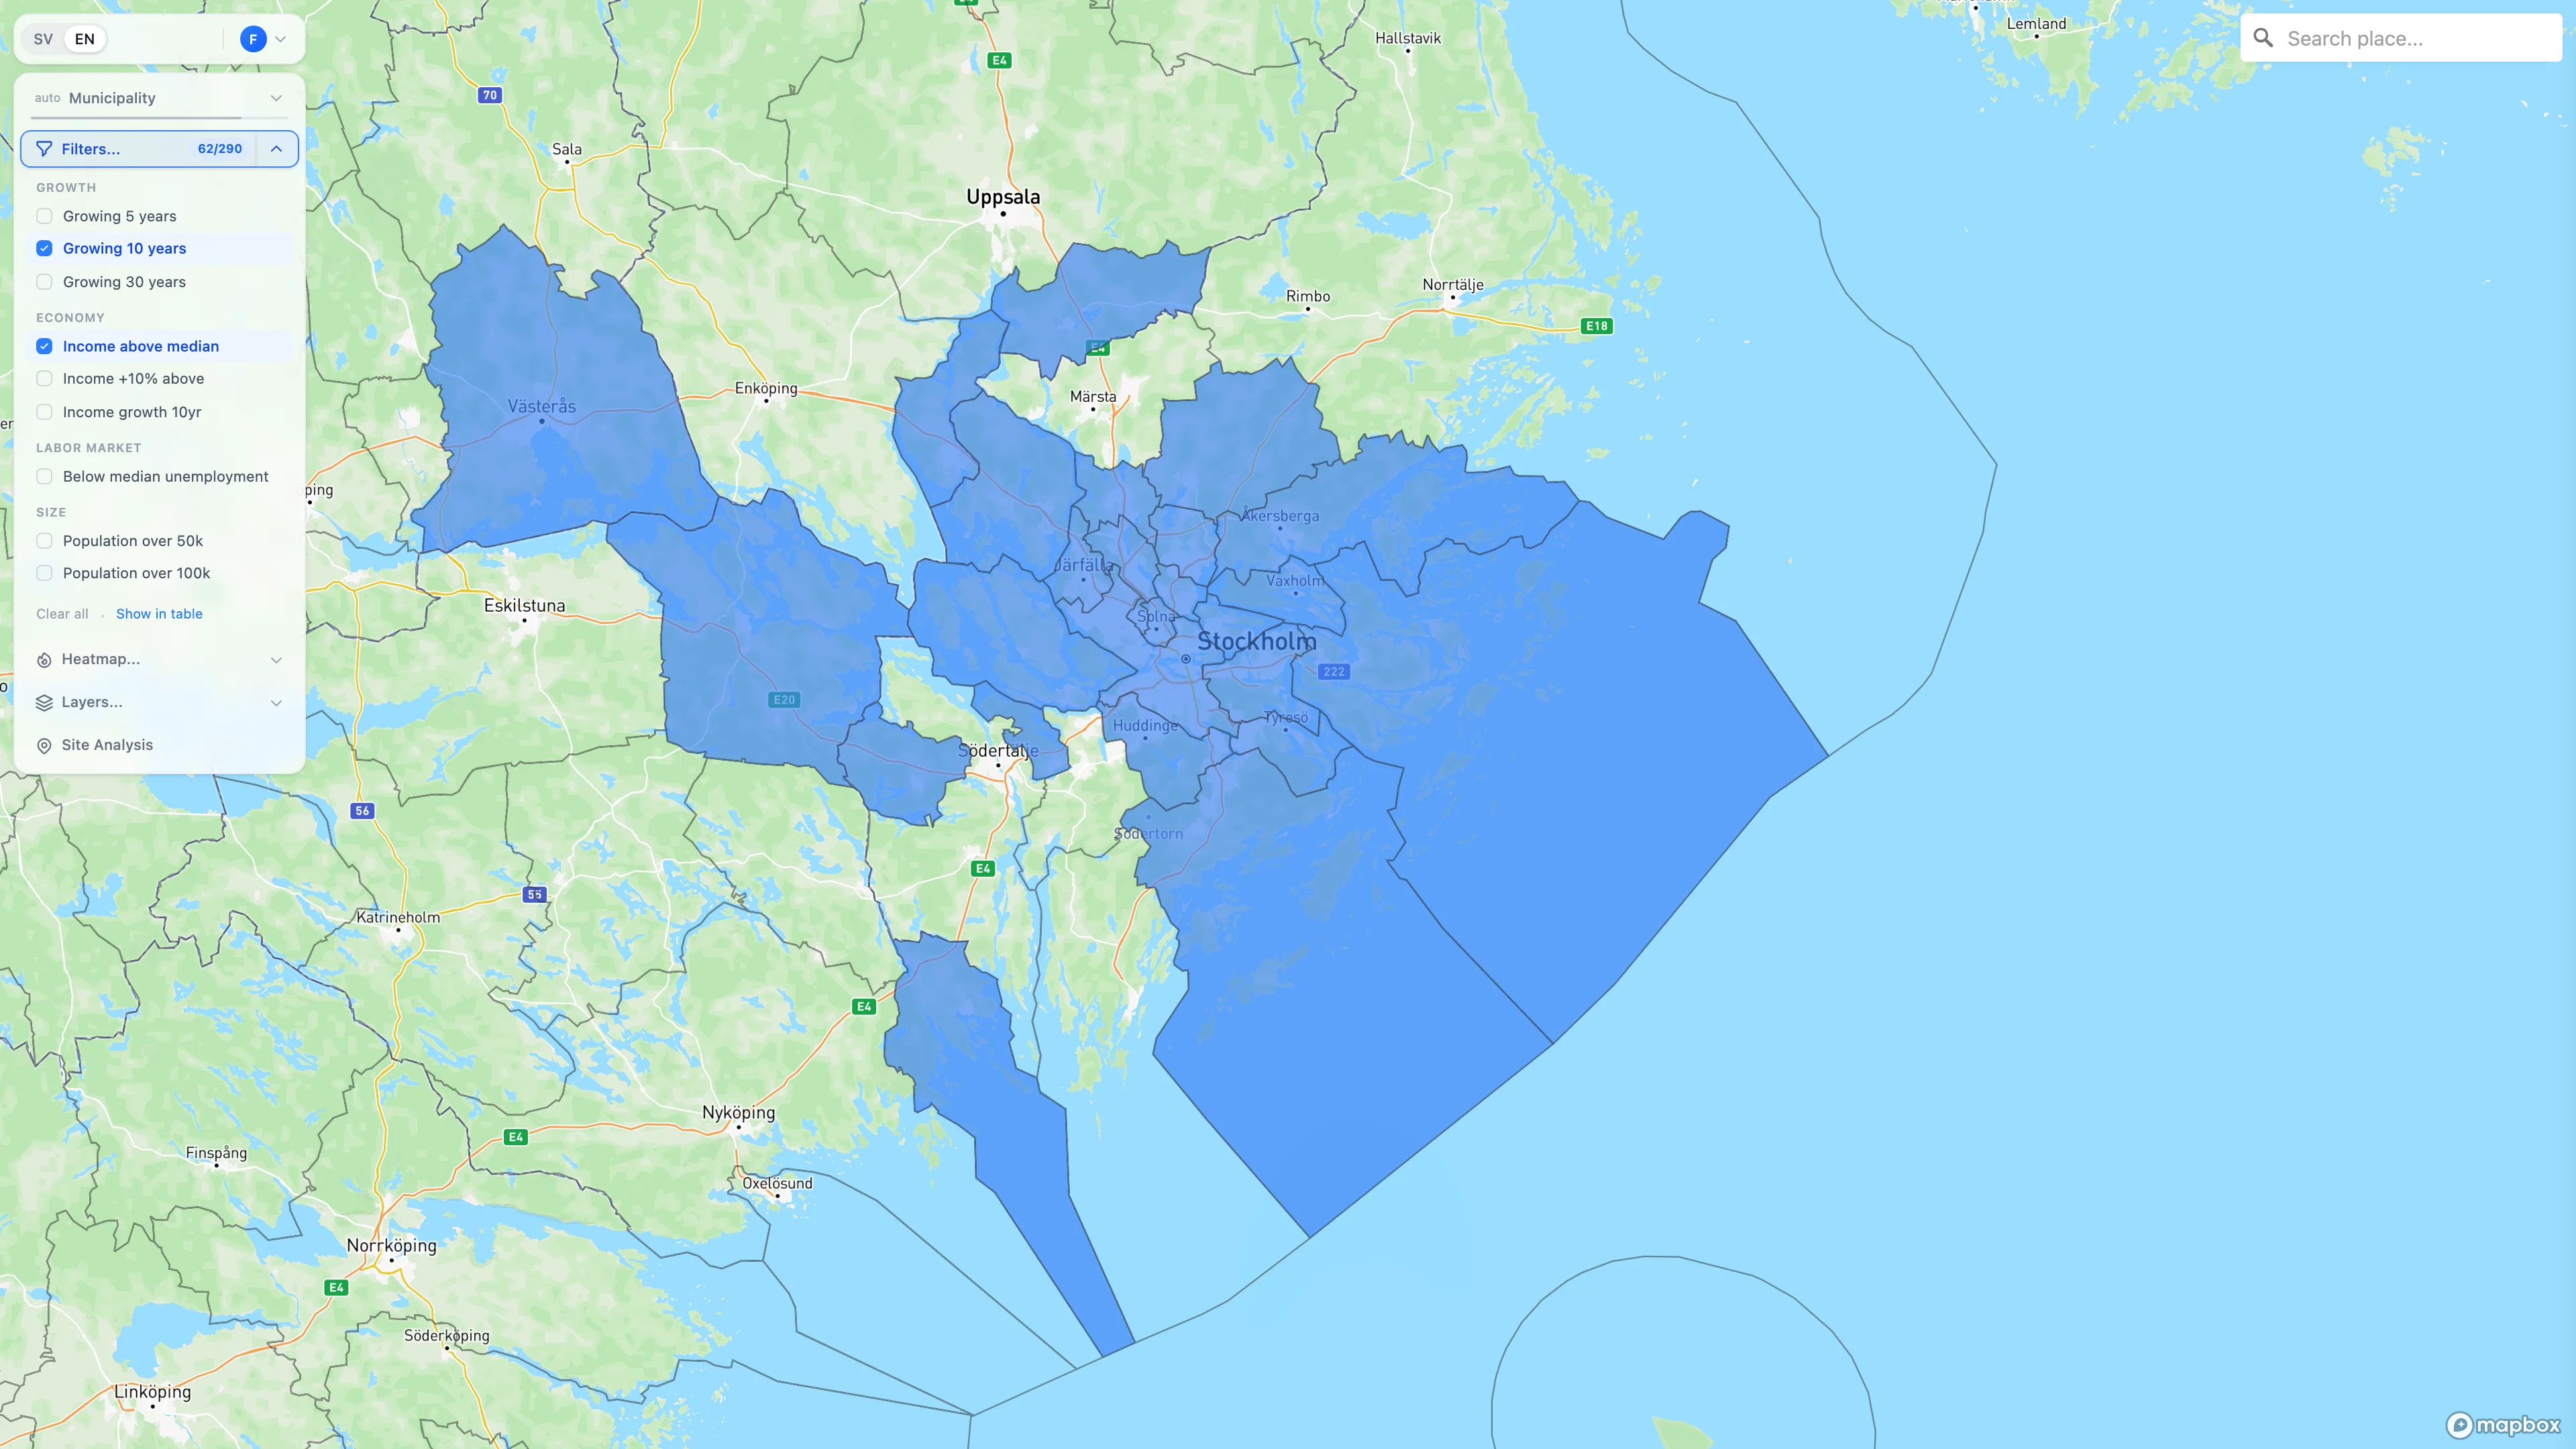
- ✓ Self-serve — explore any region in seconds
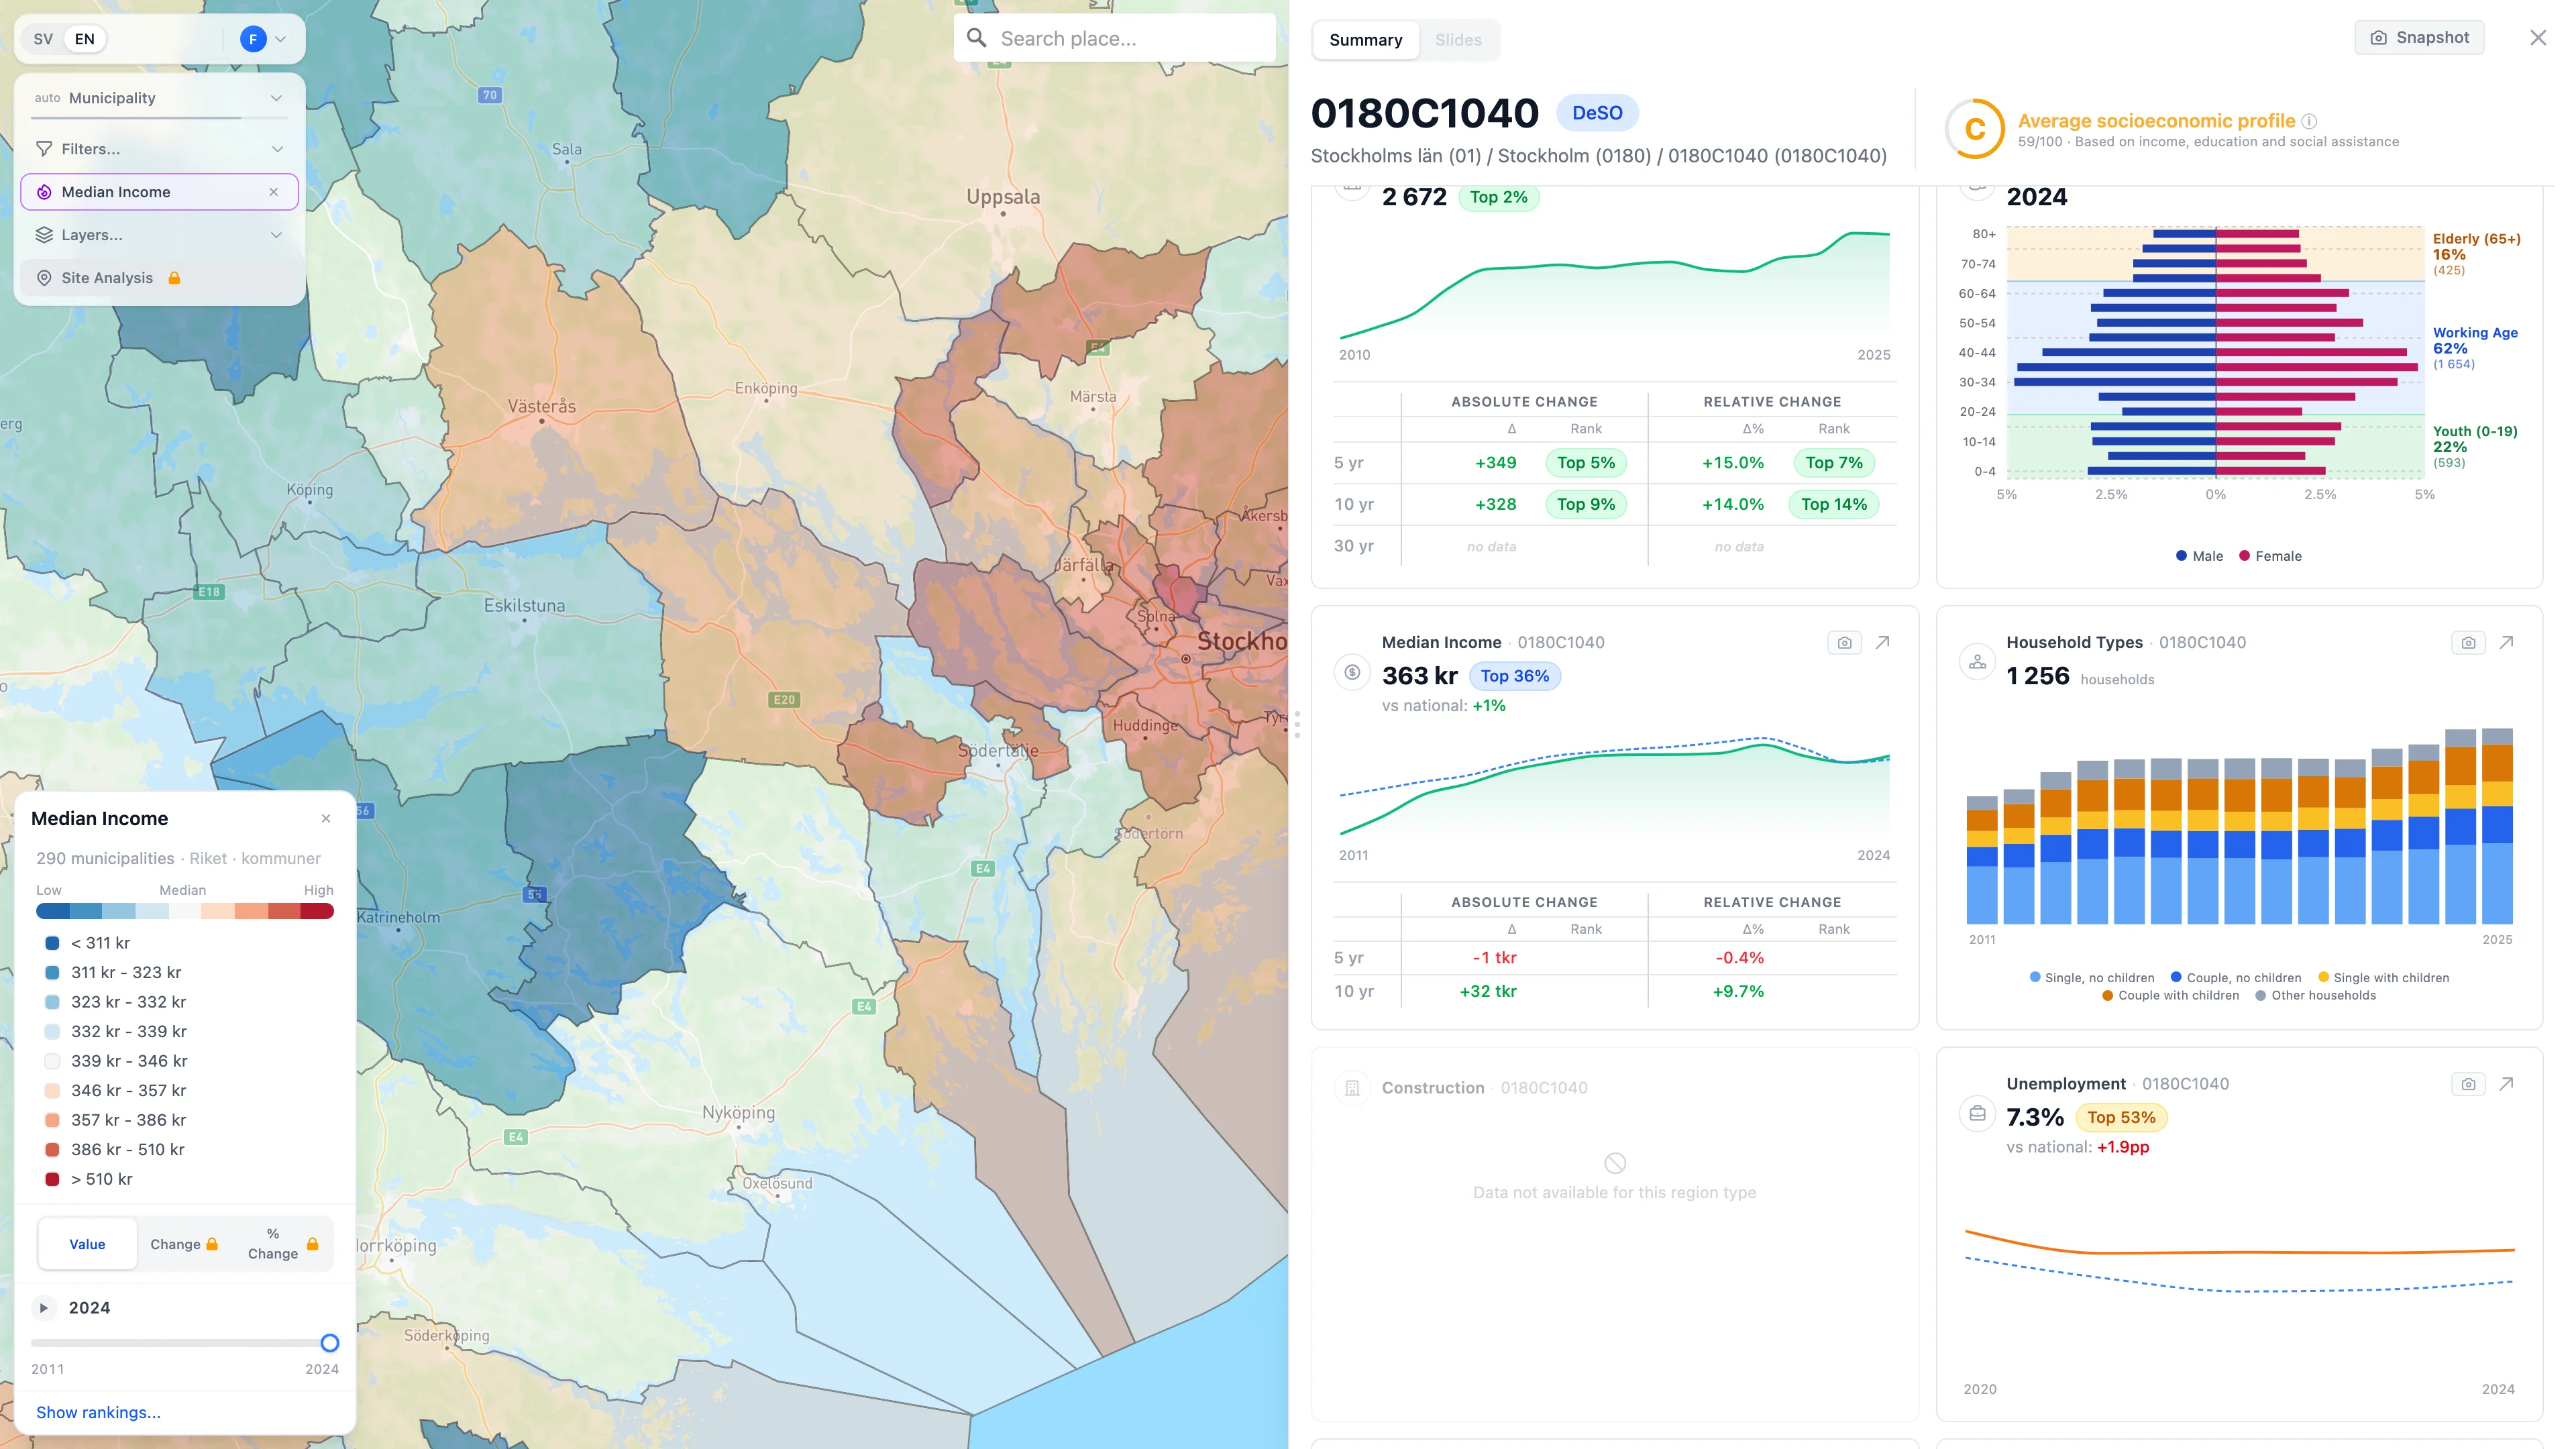
- ✓ From county overview to block-level detail in one click
- ✓ All demographics visualized, compared, and exportable
290
Municipalities
21
Counties
4
Admin levels
10M+
Data points
“We used to spend weeks gathering demographic data before entering a new Swedish market. Kommunanalys gave us the same insights in an afternoon.”
Sarah Chen
Investment Analyst, Nordic Capital Partners
“Having all demographic data in one visual dashboard has transformed how we prepare council reports. What used to take days now takes hours.”
Erik Lindström
Planning Director, Göteborgs kommun
“The export features alone save us hours per client deliverable. The charts look professional enough to go straight into our reports.”
Maria Andersson
Senior Consultant, Urban Analytics AB